-
Create a bezier of a sine wave programmatically
Hi !
I would like to programmatically draw a bezier curve that looks the most like a sine wave that has a single wave length of 1000 pixel and an amplitude of 1 (which corresponds to 319 pixels high so that the wave form looks proportional, just like a sin(x) function drawn on the Desmos Graph App).
Here are the parameters of my bezier curve:
– p1 = starting point<div>
– p2 = ending point
– h1 = outer bezier handle linked to p1
– h2 = inner bezier handle linked to p2
Since I have set the wave length at 1000 pixels to begin with, I know my p1 and p2:
– p1 = (0,0)
– p2 = (1000,0)
Now, I need to find the coordinates of h1 and h2. But I don’t know how to get there by calculation.
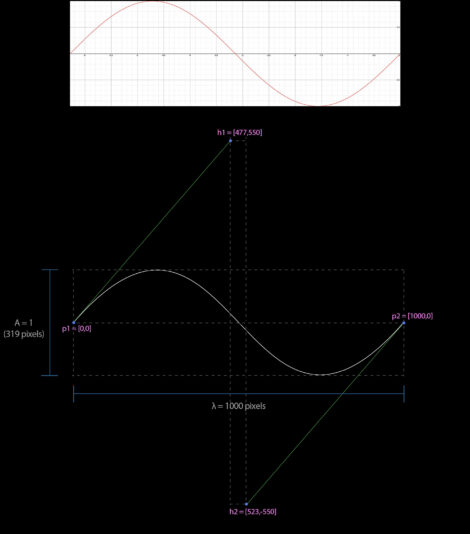
By trial and error, when playing with paths in a shape layer, I get approximately this:
– h1 = (477,550)
– h2 = (523,-550)
This is not perfect as no bezier would ever be able to represent perfectly a sine curve but it’s the closest I can get, which is actually pretty close (see picture below).
My question is: knowing my starting parameters (wave length in pixels, amplitude in pixels, p1 and p2 coordinates), how can I find mathematically and not manually h1 and h2?
After some research, it seems that a bezier function with 4 coordinates (p1,h1,p2,h2) uses a cubic equation that should look like the picture attached here below.
Where t is between 0 and 1, p1 and p2 are known while h1 and h2 are the unknown values. I don’t know what to do with this though since the wave length and the amplitude need to be accounted for so that h1 and h2 can be found.
That said, I only need to find h1 since h2 will always have as its x value the wave length minus the x value of h1; and its y value will be the negative of the y value of h1. This means there is only one unknown variable eventually, not 2.
Below is is the visual result I came up with by trial and errors (see below):
The white graph is the Desmos Graph accurate rendering of a sin(x).
Once cropped in Photoshop to make it a single wave length and edited to make it 1000 pixels wide, I used bezier (the black graph) in After Effects to replicate it. In pink you can see the values of h1 and h2 I came up with by trials and errors to get a (very) similar result.
But I don’t know how to get those two handle values mathematically and I would really like to be able to do so.
Here is the Expression I have so far in the Path Expression of a Shape layer that works if the values of h1 and h2 are plotted manually.
var p1    = [0,0]
var p2    = [1000,0];
var points = [p1, p2];
var h1 = [477,-550]; // programmatically???
var h1_trivial = [0,0];
var outTangents = [h1, h1_trivial];
var h2_trivial = [0,0];
var h2  = [-477,550]; // programmatically???
var inTangents = [h2_trivial, h2];
createPath(points, inTangents, outTangents, false);So that you know, my end game would be to extend this to any wave length and any amplitude so that I could programmatically spit h1 and h2 coordinates without hard coding them when declaring a fixed wave length and a fixed amplitude.
This seems to me like a calculation that should involve some kind of derivative optimization but I just can’t wrap my head around it.
Any help would be appreciated.