Leonie Wercker
Forum Replies Created
-

Leonie Wercker
February 20, 2021 at 2:54 pm in reply to: [Problem] Access multiple JSON files with RegEx and dynamically calculate y-Axisah, okay, will try that
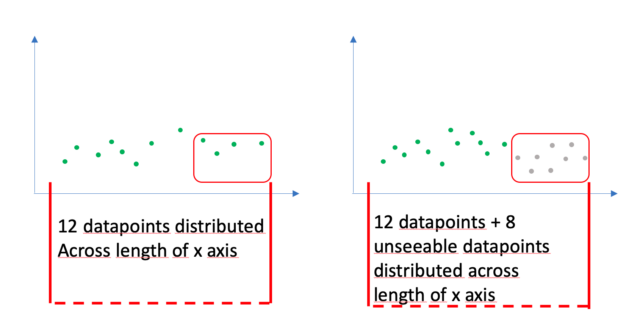
the problem in general is that I need to plot the 12 real values across the entire length of the x axis.
otherwise, the length of the x axis is consumed not by 12 but by 12 + 8 datapoints.
I tries to illustrate on the picture

-
Leonie Wercker
February 20, 2021 at 1:37 pm in reply to: [Problem] Access multiple JSON files with RegEx and dynamically calculate y-Axisbut then they are still plotted:
12 regular values plotted + 8 values with less opacity plotted = 20 values plotted across the x-axis
but I just need to plot the 12 regular values plotted.
-
Leonie Wercker
February 20, 2021 at 1:25 pm in reply to: [Problem] Access multiple JSON files with RegEx and dynamically calculate y-Axisthanks for that helpful information. I was able to process this a little further…but still having a problem.
This is my code from the null object layer (and I put in the maximum null objects layers as needed.
1) var data = footage(“Homeland.json”).sourceData; // this gets the data from the JSON file
2) var numberOfEntries = data.length; // this checks how many data items are there in the JSON file
3) var myIndex = thisLayer.index-1; // this assigns the corresponding number to this null object layer (this is where the after effects / JSON logic needs to be addressed: e.g. layer 3 receives datapoint 2 (since data points are counted starting at 0)
4) if(myIndex >= numberOfEntries) myIndex = numberOfEntries-1; // this ensures that the null objects that are great than the count of datapoints within the JSON files act as the last correct datapoint
5) var myXPosition = linear(myIndex,0,numberOfEntries-1, 250, 1700); // this plots the counted fully layers across the length of the x-axis (first entry is at X=250, last one at X=1700)
I have a problem with line 4 as I don’t want the remaining datapoints not plotted as the last known value before, but to be NOT plotted at all.
so frankly speaking, this happens now:
– count JSON file how many datapoints there are
– plot all counted datapoints according to their values
– plot those datapoints that are above the count like the last one countede.g. counted 12 values, maximum is 20 values, so a surplus of 8 values,
these 8 values become plotted with the value of the 12th valuewhat I want to happen:
– count JSON file how many datapoints there are
– plot all counted datapoints according to their values
– only plot counted values
– delete/ignore surplus 8 valuesthanks for any ideas on this 🙂
-
Leonie Wercker
January 18, 2021 at 4:12 pm in reply to: [Problem] Access multiple JSON files with RegEx and dynamically calculate y-AxisThere are both files in this dropbbox folder:
https://www.dropbox.com/sh/a1lgjlxes868qwj/AAA5PxN8xCVS_8XT7O2sTJGha?dl=0
I am stuck with this:
The animation works for this JSON file. However, I have multiple other JSON files – and these vary with regards to the datapoints on the x axis.
Thus, I am looking for an expression that automatically checks, how many datapoints are in each JSON file when loaded and distributes them evenly/symmetrically along the x-axis.Would any of you have an idea for that?
-
Leonie Wercker
January 14, 2021 at 8:29 pm in reply to: [Problem] Access multiple JSON files with RegEx and dynamically calculate y-Axisi tried but json files are not possible to upload. so i renamed it to .txt file. but this wasnt uploaded either. can i contact you directly here?
-
Leonie Wercker
January 13, 2021 at 6:32 pm in reply to: [Problem] Access multiple JSON files with RegEx and dynamically calculate y-Axisthis is the project file, a picture of the issue and the data file (you have to rename it to .json as json files cannot be uploaded here)
thanks!!!