

Activity › Forums › Adobe After Effects › Help – Exponential Grid
-
Help – Exponential Grid
Posted by Korro Siv on November 2, 2022 at 8:56 pmHello
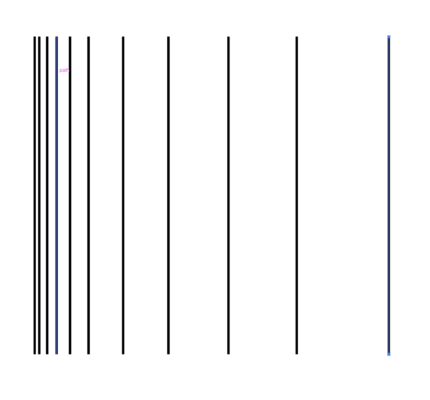
I’m trying to generate an ‘exponential grid’ ?? in After effects using the Repeater.
I don’t know if that is what to call it – but basically I want to make a set of lines are not spaced equally but spaced exponentially – like a gradient –
I’ve attached a photo –
I’m guessing this might need an expression of some sort – would really appreciate any help with this.Thanks
 Christiaan Vee replied 3 years, 9 months ago 4 Members · 6 Replies
 -
6 Replies
-

Walter Soyka
November 2, 2022 at 10:50 pmI don’t think you can do this with a repeater; I’d do it with multiple layers.
See attached project. It’s a bit of a weird idea, but we can use the graph editor to visually define a function that we can use to drive other values. The best part is, that function can be mathematically precise, or it can be art-directed as you need, just be tweaking the curve. In this project, I have applied exponential easing to the “Distribution Curve (0-1)”.
How does this work?
A function takes an input (x) and returns an output (y). By defining the graph of our functioni in the timeline, we can use time as X (input) and the value of the property as Y (output). We can then get that Y value with the valueAtTime() expression, and rescale it to whatever values we need in our comp.
Big picture: we’re using this curve/function to drive their X position as their layer index increases.
More details: The comp has a CONTROLS layer with selectors for the first and last layers in the set, and the minimum and maximum X values to assign. For each shape layer, as its index goes from the index of the first chosen layer (currently 2) to the last chosen layer (currently 21), we sample along the curve we made from our input time=0 to time=1. As that the output of the function goes from 0 to 1, we position the layer from the minimum to the maximum value.
Then, just to be really fancy, we have a Strength setting that allows you to animate the layers from the positions you define with the XPosition property for each to their correct location in the distribution (as strength goes from 0 to 100). Right now, they’re distributed horizontally, but if you selected all the Shape layers and used the Align Left button, they’d all start at 0 (the left edge of the frame) and go out to their positions as you animate Strength from 0 to 100.
Check it out and ask questions!
-

Filip Vandueren
November 3, 2022 at 9:14 amHi Korro, (and Walter)
it’s possible without expressions:
– Draw a vertical Line
– enable the stroke
– center the anchor point (if that feature is not on by default)
– add a repeater, but before the stroke (we don’t want to scale the stroke’s width, only the path)
– settings for the repeater are:
- anchorpoint : the same as your layer’s anchorpoint, but -1 pixel on x.
you can also use this expression for it if you don’t want to type the number manually:
anchorPoint-[1,0];
- Position: [0,0]
- Scale: depends on the power distribution you want.
for example [200,100] will give horizontally powers of 2 (200%)
Now adjust the number of copies.
Note that if you have too many copies, internally After effects is dealing with a shape that’s millions, trillions,… of pixels wide and stuff will break and give unexpected results.
- anchorpoint : the same as your layer’s anchorpoint, but -1 pixel on x.
-

Christiaan Vee
November 29, 2022 at 4:26 pm[ edit: don’t know how to delete my post, I’ve figured out that I can use Math.pow(value, exponent) ]
Both are interesting solutions. I have a similar but different question. I’m trying to write something exponential and want to use a for loop, but I’m getting stuck. In the following example R is a slider with a value around 1.2 and x is the power I want R multiplied to. This is then multiplied with the Y value to get an exponential curve of dots.
R = thisComp.layer(“settings”).effect(“R”)(“Slider”);
x = 13;
for (i=1; i < x; i++){R == R * R};
[value[0], value[1] * R];
R is remaining at the first value, not being multiplied by 13 times. Honestly, I don’t have a firm grasp on for loops. Alternatively is there an expression for R to the power X?
Thanks
-
Walter Soyka
November 29, 2022 at 6:19 pmYes, Math.pow() is the best way to solve this problem!
There are three reasons why your for loop wasn’t working:
1. The loop will execute 12 times, not 13, because you’re testing if i is less than x. For it to execute the last time, you want to test if i is less than or equal to x (written “i <= x”).
2. The double-equal sign in the body of the loop tests equality, it does not assign a value. R will never change. Use a single equal sign here instead.
3. The algorithm has a bug; you’re not multiplying it by itself x times, you’re squaring it X times. You need a separate variable to track the original value as well as the accumulating value.
Again, Math.pow() is the right way to solve it, but here’s the for() loop solution:
R = thisComp.layer("settings").effect("R")("Slider");
var x = 13;
var accumulatingValue = 1;
for (i=1; i <= x; i++) {
accumulatingValue = accumulatingValue * R; // this can also be written like this: "accumulatingValue *= R;"
};
[value[0], value[1] * accumulatingValue];
-
Christiaan Vee
November 30, 2022 at 8:57 amThanks for taking the time to explain the for loop. There are a couple of really useful things to take away. I had guessed that I would need an accumulating variable in there too, but didn’t know how to put it together.
Reply to this Discussion! Login or Sign Up